Specialty and standard coffee beans can be sorted using multispectral imaging and artificial intelligence
Researchers in Brazil have developed a selection method performed directly with coffee beans in real time. It does not require roasting, does not destroy the samples and can be included as a step in the production process.
Multispectral images based on reflectance and autofluorescence are processed using mathematical models
Winston Pinheiro Claro Gomes
The process of selecting specialty coffee beans entails three kinds of inspection. Two are physical and involve samples of raw and roast coffee. The third is sensory and involves tasting the drink. Certification is provided by the Specialty Coffee Association of America (SCAA).
In accordance with SCAA guidelines, coffee quality is measured on a decimal scale from zero to 100. A specialty coffee must score 80 or more. The grower sends a sample of raw beans to three cuppers (tasters), who roast and make coffee from each batch, again in compliance with SCAA standards, before issuing a report.

However, Brazilian scientists at the University of São Paulo’s Center for Nuclear Energy in Agriculture (CENA-USP), collaborating with colleagues at Luiz de Queiroz College of Agriculture (ESALQ-USP) and the Computer Center at the Federal University of Pernambuco (UFPE), have developed a coffee bean selection method based on multispectral imaging and machine learning. The method does not require roasting and can be performed in real time during the production process. It avoids possible human error, although it relies on expensive equipment. An article about the new method has recently been published in Computers and Electronics in Agriculture.
“Specialty coffees are often selectively harvested, meaning only the ripe red cherries are picked. They’re harvested individually by hand. If a specialty coffee grower harvests green beans, or at any time uses strip picking, manual and/or mechanized, this procedure can result in a standard commercial crop,” said Winston Pinheiro Claro Gomes, first author of the article. Gomes is a PhD candidate in chemistry at CENA-USP, with Wanessa Melchert Mattos and Clíssia Barboza da Silva as thesis advisors.
“In our method, we separate beans considered specialty and standard commercial using a combination of multispectral imaging and mathematical algorithms that process the data provided by the images,” Gomes explained. “Specialty coffee must score between 80 and 100, but our model can’t tell whether beans are 80 or 90. That would require machine learning with samples for each score in order to specify these categories in the mathematical model.”
The research was conducted with the support of a Young Investigator Grant awarded to Barboza da Silva, penultimate author of the article, and a Regular Research Grant, awarded to Mattos, last author of the article.
Multispectral methodology
The team used a multispectral imaging (MSI) technique based on reflectance and autofluorescence, in which images of the same object are taken at different wavelengths, followed by a machine learning model to classify beans according to the information gleaned from the images.
“The use of MSI in the coffee industry is very recent. It’s mostly used to map nitrogen in coffee groves, detect necrosis in beans, and detect pests and diseases in plants, as can be seen from the literature on the subject,” Gomes said.
The researchers analyzed 16 samples of green beans from specialty and standard commercial crops grown in the states of Minas Gerais and São Paulo. Ten of the specialty coffee beans (Coffea arabica) were from the 2016/17 crop grown in the Alta Mogiana region. They had been rated in the 2017 Alta Mogiana Coffee Contest and were supplied by the region’s association of specialty coffee producers. The other six samples were taken from standard commercial crops bought in bulk on the local market.
For each sample, 64 beans without prior treatment were separated at random, giving a total of 1,024 beans (384 standard, 640 specialty), and used for machine learning calibration, validation and testing.
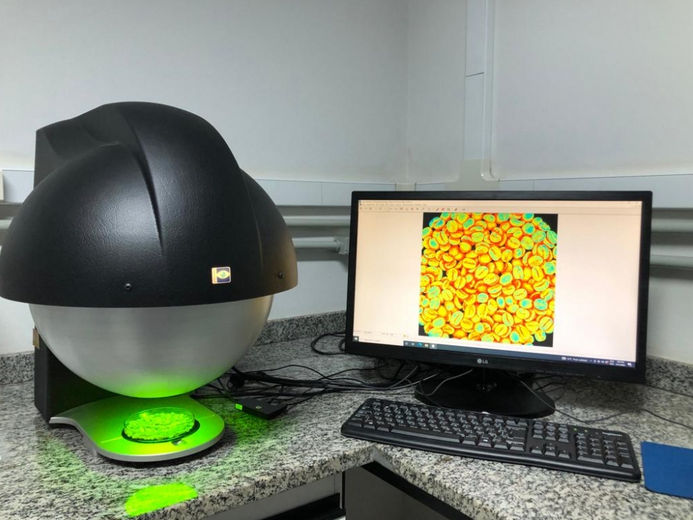
Gomes summarized the procedure as follows: “We placed the beans in a Petri dish and put it in the device, which is a sphere containing LEDs, optical filters and a camera. The camera descended over the samples until they were completely covered and captured images after homogeneous and diffuse illumination at different wavelengths. It first took monochrome reflectance images and then autofluorescence images, after which information relating to the regions of interest was extracted by the on-board software and used to build the algorithms that classified the samples and gave us the results.”
Principal component analysis (PCA) was then performed to investigate the variables that influence the differences between specialty and standard coffees. The researchers ran four machine learning algorithms, with the support vector machine (SVM) proving the best and being used to calculate coefficients for estimating the key variables.
Fluorescence
Specialty beans were seen to be more uniform in shape in the visible spectrum (RGB) images, while standard beans were more intense in the autofluorescence images. “Our mathematical model and algorithms use signal intensity information from fluorescence images. It may happen that some compound present in beans is more excited at a particular wavelength. A more or less intense fluorescence signal may also relate to variation in the concentration of a compound in beans, for example. The model we chose was the one that performed best in distinguishing between specialty and standard coffee beans. In this model, the most important information for the purpose of constructing separation boundaries came from the green fluorescence. We therefore decided to analyze the individual compounds that naturally display green fluorescence and tried to associate some fluorescent compounds that might influence the coffee grading separation process,” Gomes said.
Green fluorescence, a biological marker represented by green light in the visible spectrum, was analyzed for 10 phenolic compounds, and the data showed that catechin, caffeine and certain acids (4-hydroxybenzoic acid, sinapic acid and chlorogenic acid) responded intensely after being excited with blue light at 405 nanometers (nm), emitting energy at 500 nm. This autofluorescence data (excitation/emission at 405/500 nm) contributed most to distinguishing green specialty beans from green standard beans.
“These are chemical species associated with aromatic groups that absorb energy relating to a specific wavelength. In autofluorescence-based methods, variations in levels of these chemical species in specialty and standard grades of coffee can be used to distinguish between the two groups,” Gomes said.
Differences in levels of these compounds are typically used to distinguish between specialty and standard coffee beans. “For my master’s research, I studied the chemical composition of these samples, and although there were no differences in chemical species, we found variations in their concentrations, especially the levels of chlorogenic acid and caffeine,” he said.
Next steps, according to Gomes, will entail obtaining samples from each of the SCAA-defined score levels for specialty coffees (no easy task) and classifying the beans according to their scores. “In Brazil, coffees are rated at most 90-92. It’s hard to find any higher than that. Only imported coffee, from Ethiopia, for example, scores 100. In my PhD research, I’m attempting to classify beans on the basis of X-ray images, and I’ve decided to increase the number of samples and the breadth of the analysis by including imported beans,” he said.
Original publication
Other news from the department science


Most read news


More news from our other portals


See the theme worlds for related content
Artificial intelligence (AI) for food and beverages
Artificial intelligence (AI) is optimizing the food and beverage industry through automated quality control and more accurate demand forecasting. AI plays a particularly important role in product development by analyzing taste preferences and market trends. This allows new products to be developed that are better tailored to consumer needs, increasing efficiency and customer satisfaction.